

There is a bunch of talk these days about data-driven marketing versus data-informed marketing.
Is there really a difference?
An often-overlooked aspect of data is context. Let’s talk about the recent coronavirus outbreak.
Here is the data as of February 7, 2020.
20,000 illnesses
427 deaths
Now let’s compare that to the flu or influenza in the United States.
|
|
Coronavirus in China |
Influenza in the United States |
|
Illnesses |
20,000 |
19,000,000 |
|
Deaths |
427 |
10,000 |
|
Hospitalizations |
|
180,000 |
When viewed this way, it may appear that the coronavirus is not a significant problem. Comparison does not always include context. So far this season about 0.05% of those who caught the flu have died. Now for some context, the death rate for those who have caught the coronavirus is around 2%. This is such a significant problem the Centers for Disease Control and Prevention have created a website dedicated to the Coronavirus.
While certainly not life threatening, data needs context in marketing as well.
A/B and/or Multivariate Tests
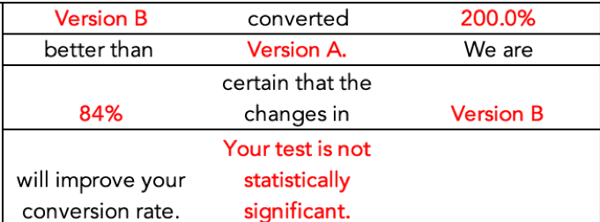
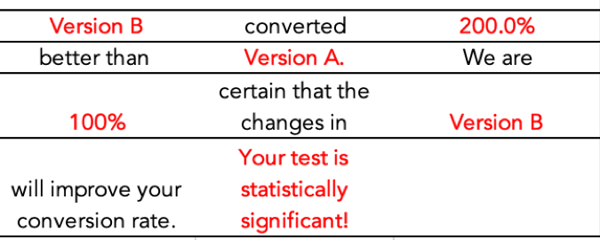
200% increase in Lead Conversion.
This sounds amazing, but what is the context? Did you go from one lead to two? Ten to Twenty? Is that a significant change?
Here is a quick example:
You have 1,000 visitors to your website.
You try two versions to improve results.
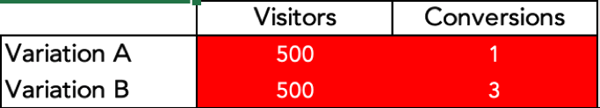
While this is an amazing improvement in conversions, can we attribute it completely to the changes we made?
What does it mean for something to be Statistically Significant?
If you perform an internet search on statistical significance you go into the weeds very quickly.
We will not go into the math behind statistical significance, if you really want to know do an internet search.
In simplest terms, statistically significant means it did not happen by chance.
A key element of significance is sample size. This is very important when evaluating your marketing results. You really need to know if a change had an impact on the outcome.
The Law of Large numbers.
You roll a pair of dice. What are the odds you will get a one? 1 in 6. Now roll the dice. Did you get a one? Roll ten times. 100 times. 1,000 times. See where this is going? The larger the sample size the more likely you are to get the expected result on average.
So, let’s increase website traffic 10-fold. Maybe you do this through paid ads or paid content creation.
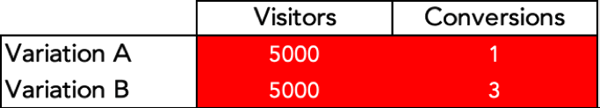
You still have a 200% difference in conversion rate, but you did not increase the number conversions. You made a decision based on data, but the data was not statistically significant, and everyone is now unhappy with the money spent and the results produced.
Now let’s take the same sample size and just add a zero to conversion rates.
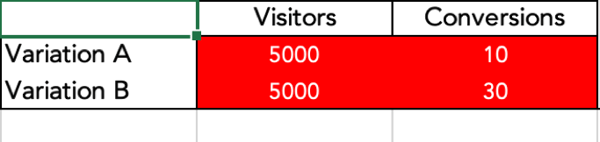
See what happens? Same conversion rate, but it is statistically significant. In other words, you can have a measure of confidence that your change effected the results.
This is the context you are looking for when making decisions on your marketing. A simple statement of 200% improvement must be viewed in context.
We strongly encourage you to download your own calculator from HubSpot and examine your marketing performance in context.
Does a lack of statistical significance always mean you will fail when you scale up? No.
How do you inform your marketing decisions with data?
Another area of confusion is the concept of correlation. You perform an A/B or Multivariate test and it works great! Time to scale up. Wait just a minute, don’t invest additional marketing dollars based on correlation alone.
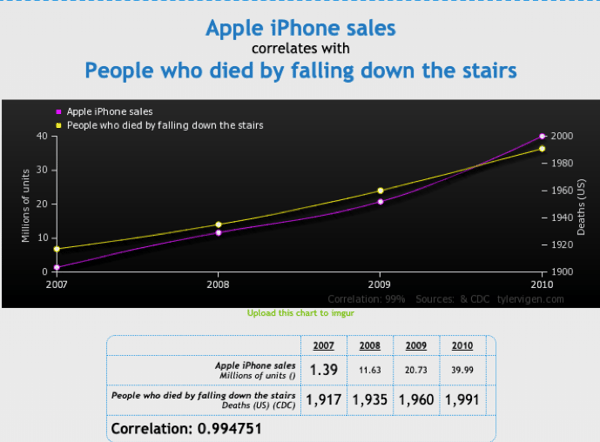
This is one of my favorites from the Spurious Correlations website. Correlation does not mean causation. We want to believe our brilliant marketing caused great results, but we must use holistic reasoning skills to inform our decision-making. In a large organization, there may be multiple activities that impact results.
Be cautious when assigning cause and effect.
Did sales attend a big trade show?
Was new marketing collateral just mailed?
Is the website updated and optimized for SEO?
How are you supposed to manage all of these possible contributors?
Keep records of changes.
Use annotations in Google Analytics.


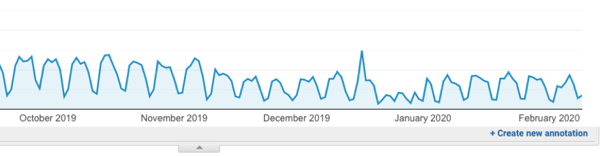

You should make annotations at the time of the event. It is difficult to go backward and assign events after the fact. This extra step will allow you to see blips in your data and inform better attribution.
Use Campaign Tracking
Google offers a free tool called Campaign URL Builder.

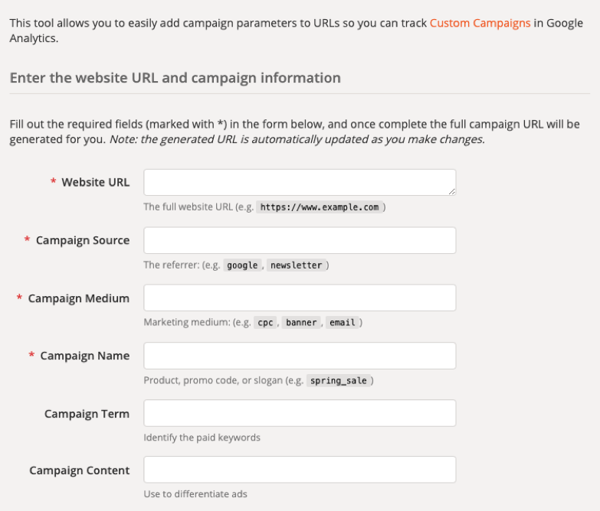
This is an easy way to measure the impact of emails and other linking efforts on your website.
Assign marketing assets to campaigns.
Many marketing platforms, such as HubSpot, have built-in tools that do this for you.
What’s the difference between a campaign and a utm_campaign?
HubSpot campaigns are used to tag related marketing assets and content in HubSpot so you can easily measure the effectiveness of your collective marketing efforts.
utm_campaign tags are used to track traffic to your website. HubSpot campaigns may include traffic tagged with utm_campaign parameters, but not all utm_campaign parameters are necessarily related to a HubSpot campaign.
HubSpot campaigns are a group of related marketing assets and content under a specific marketing campaign. Associating marketing assets and content in HubSpot to a campaign allows you to measure the effectiveness of your collective marketing efforts.
Source: HubSpot
It will look something like this:
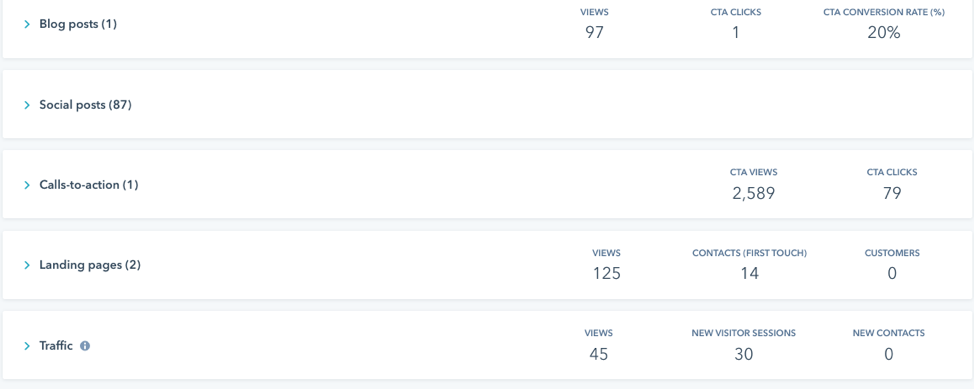
You can then drill down to see what assets are having the best impact.
If you have taken a statistics course, you have probably heard the phrase:
Figures don’t lie, but liars can figure.
An effective way to safeguard against this is to go into every A/B or Multivariate test to be a failure. Don’t look for successes; look for failures. This can help offset the tendency to make correlations to causations that don’t exist.
One of my favorite blogs is Occam’s Razor by Avinash Kaushik.
Here is one reason why:
Great Analyst's Best Friends: Skepticism & Wisdom!
Here's something important I've observed in my experience of working with data and changing organizations with ideas: Great Analysts are always skeptical. Deeply so.
This was always true, of course. But, it has become mission-critical over the last few years as the depth, breadth, quantity, and every other dimension you could apply to data has exploded. There is too much data. Too many tables/charts/"insights" are being rammed down your throat. There has been an explosion of "experts."
If you are not skeptical, you are going to die (from a professional perspective).
… skepticism flag should be: Look for things in the data-set that disprove the summary statement.
… skepticism flag (for a smart Analyst, usually this is the first one) should be the perennial favorite: Correlation does not imply causation!
Read the blog: https://www.kaushik.net/avinash/great-analyst-skills-skepticism-wisdom/
Data-Driven or Data-Informed?
BOTH!
Be skeptical when running A/B tests and look for failure, not success.
All data has context. Apply it.
Don't invest additional resources without examining statistical significance.
Do you still have questions?

You may also want to read: